Q2 2025 CCP volumes and share in CRD and FXD |

This blog reviews central counterparty (CCP) volumes and market share for cleared credit derivatives (CRD) and FX derivatives (FXD) in Q2 2025.
For all-currency CRD, comparing Q2 2025 with Q2 2024, we see 45 percent volume increases, with indexes up 46 percent, single-names up 11 percent, and swaptions up 152 percent. Analyzing by currency shows that:
- USD CRD grew by 51 percent, with ICE taking back some of the LCH recent share gains in CDX swaps.
- EUR CRD were up 34 percent, with LCH taking back some of the ICE recent share gains in iTraxx swaptions.
- JPY CRD rose by 49 percent, all at JSCC.
Comparing Q2 2025 with Q2 2024, we see 31 percent overall volume increases in cleared FXD – NDF, options, forwards, and spot. By product, we show that:
- NDF volumes were up 25 percent compared with Q2 2024, led by INR and TWD, which were up 39 percent and 40 percent respectively.
- FX options volumes grew by 59 percent, led by EUR and JPY, which increased by 63 percent and 167 percent respectively.
- FX options outstanding notional increased by 89 percent, led by EUR – up 93 percent, JPY – up 152 percent, and GBP – up 128 percent.
All the charts and details in this blog were sourced from CCPView.
Cleared CRD volumes
First, we look at CRD in all currencies by product type: CDX, single-name CDS, and swaptions.

Chart 1: Quarter-by-quarter all-currency CRD volumes by product (notional USD millions).
Chart 1 shows that all-currency CRD were $6.88 trillion in Q2 2025, up 45 percent from $4.75 trillion in Q2 2024, but down 18 percent from $8.35 trillion in Q1 – usually the largest volume quarter in the year.
- Indexes (CDX) were $6.29 trillion, up 46 percent YoY from $4.31 trillion, but down 17 percent QoQ from $7.60 trillion.
- Single-name CDS were $414 billion, up 11 percent YoY from $373 billion, but down 35 percent QoQ from $639 billion.
- CDX swaptions were $176 billion, up 152 percent YoY from $69.8 billion, and up 64 percent QoQ from $108 billion.
First, we look at USD CDX, single-name CDS, and Swaptions.
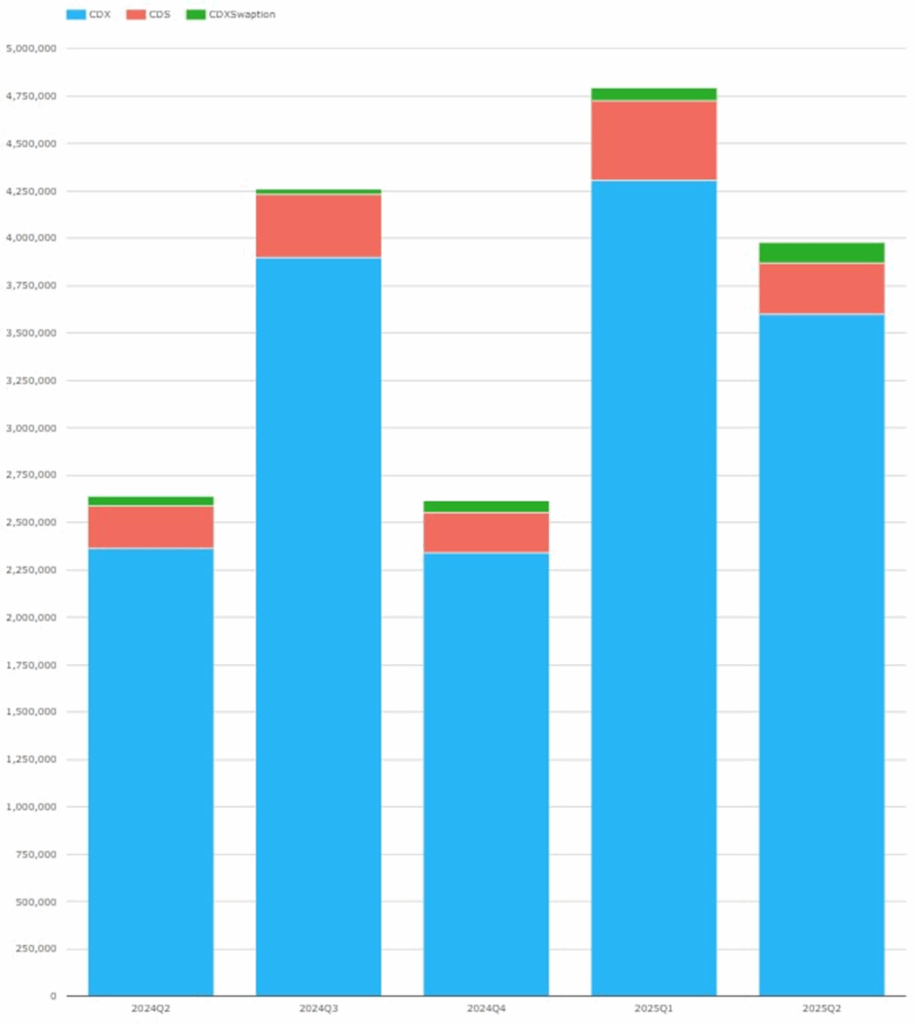
Chart 2: Quarter-by-quarter USD CRD volumes by product (notional USD millions).
Chart 2 illustrates the overall $3.98 trillion of USD CRD in Q2 2025, up 51 percent from $2.64 trillion in Q2 2024, but down QoQ from $4.79 trillion.
- USD CDX were $3.60 trillion, up 53 percent from $2.36 trillion, but down QoQ from $4.31 trillion.
- Single-name CDS were $271 billion, up 20 percent from $225 billion, but down QoQ from $417 billion.
- CDX swaptions were $107 billion, up 103 percent from $52.8 billion, and up QoQ from $70.9 billion.
Now we look at USD CRD market share, starting with CDX.
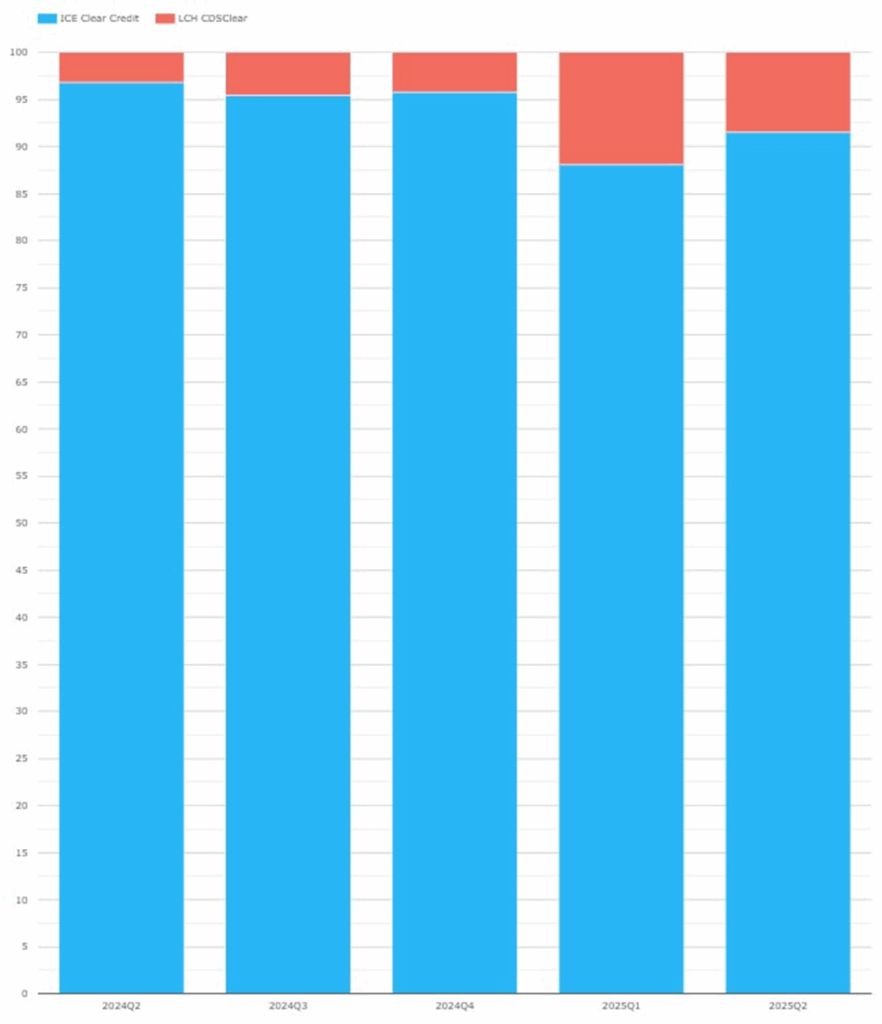
Chart 3: Quarter-by-quarter USD CDX market share by CCP.
Chart 3 shows that in Q2 2025 ICE took back some of LCH’s Q1 2025 market share gains.
- ICE Clear Credit had 91.5 percent of USD CDX in Q2 2025 – down YoY from 96.8 percent, but up QoQ from 88.0 percent.
- LCH CDSClear had 8.5 percent – up YoY from 3.2 percent, but down QoQ from 12.0 percent.
Next, we look at the market share of USD single-name CDS.
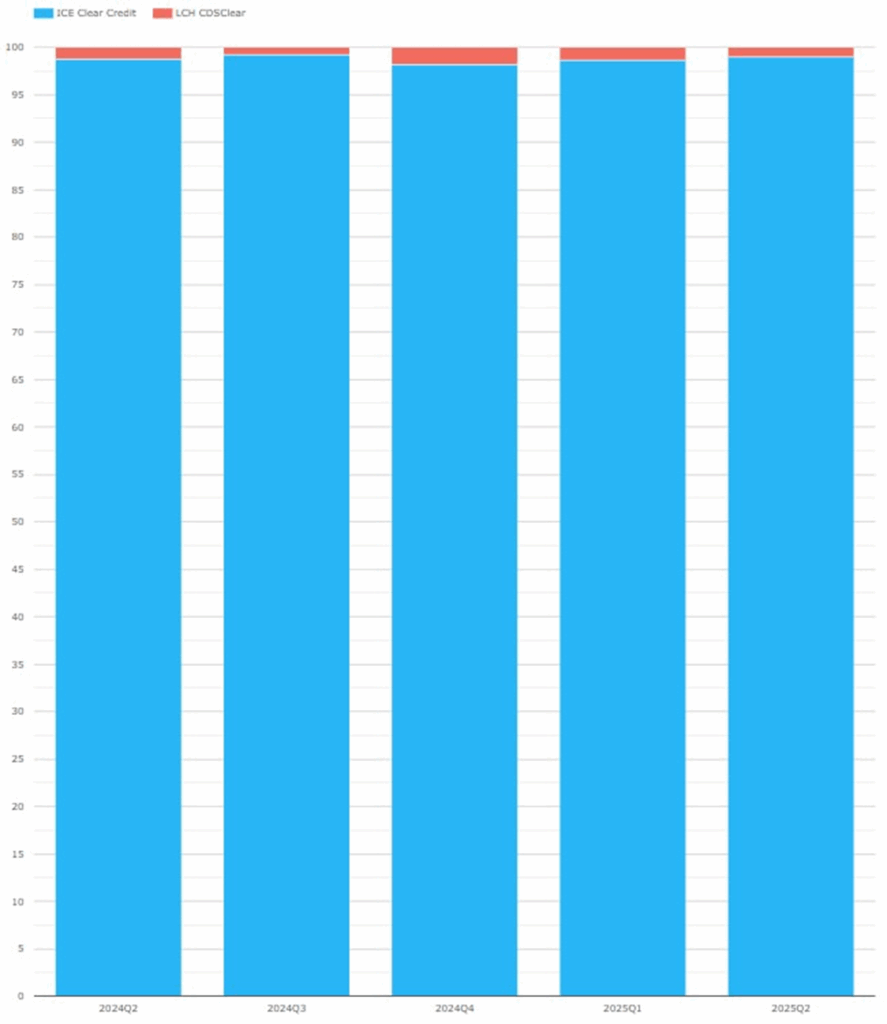
Chart 4: Quarter-by-quarter USD single-name CDS market share by CCP.
Chart 4 shows slight changes in USD single-name CDS CCP market shares in Q2 2025 compared with Q2 2024 and Q1 2025.
- ICE Clear Credit had 99 percent of USD single-name CDS in Q2 2025 – slightly up YoY from 98.8 percent and slightly up QoQ from 98.6 percent.
- LCH CDSClear had 1 percent – slightly down YoY from 1.2 percent and slightly down QoQ from 1.4 percent.
USD CDX swaptions volumes were all at ICE Clear Credit, so no chart is needed.
Now, we come to EUR CRD.
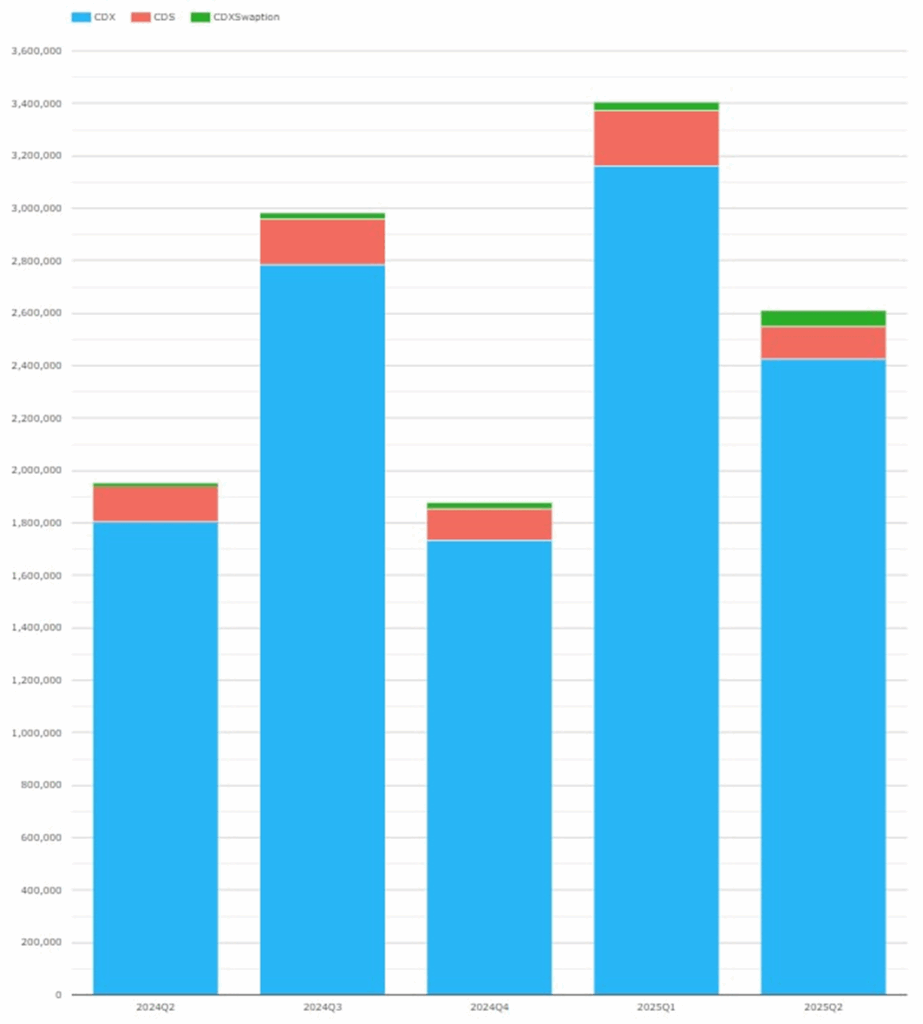
Chart 5: Quarter-by-quarter EUR CRD volumes by product (notional EUR millions).
Chart 5 shows large quarter-on-quarter ups and downs, with EUR CRD volumes settling at €2.61 trillion in Q2 2025, up 34 percent from €1.95 trillion in Q2 2024, but down QoQ from €3.41 trillion.
- EUR iTraxx were €2.42 trillion, up 34 percent YoY from €1.80 trillion, but down QoQ from €3.16 trillion.
- EUR single name CDS were €127 billion, down 6.5 percent YoY from €136 billion, and down QoQ from €212 billion.
- EUR iTraxx swaptions were €62.6 billion, up 297 percent YoY from €15.8 billion, and up QoQ from €35.4 billion.
Now, let us look at CCP market share, starting with EUR iTraxx.

Chart 6: Quarter-by-quarter EUR iTraxx market share by CCP.
Chart 6 shows small changes in EUR iTraxx CCP market share in Q2 2025 compared with Q2 2024.
- ICE Clear Credit had 72.9 percent, slightly down YoY from 74.1 percent, with Q3 2024’s increase offset by smaller reductions in each of the last two quarters.
- LCH CDSClear had 27.1 percent, slightly up YoY from 25.9 percent.
Next, we come to CCP market share of EUR single-name CDS.
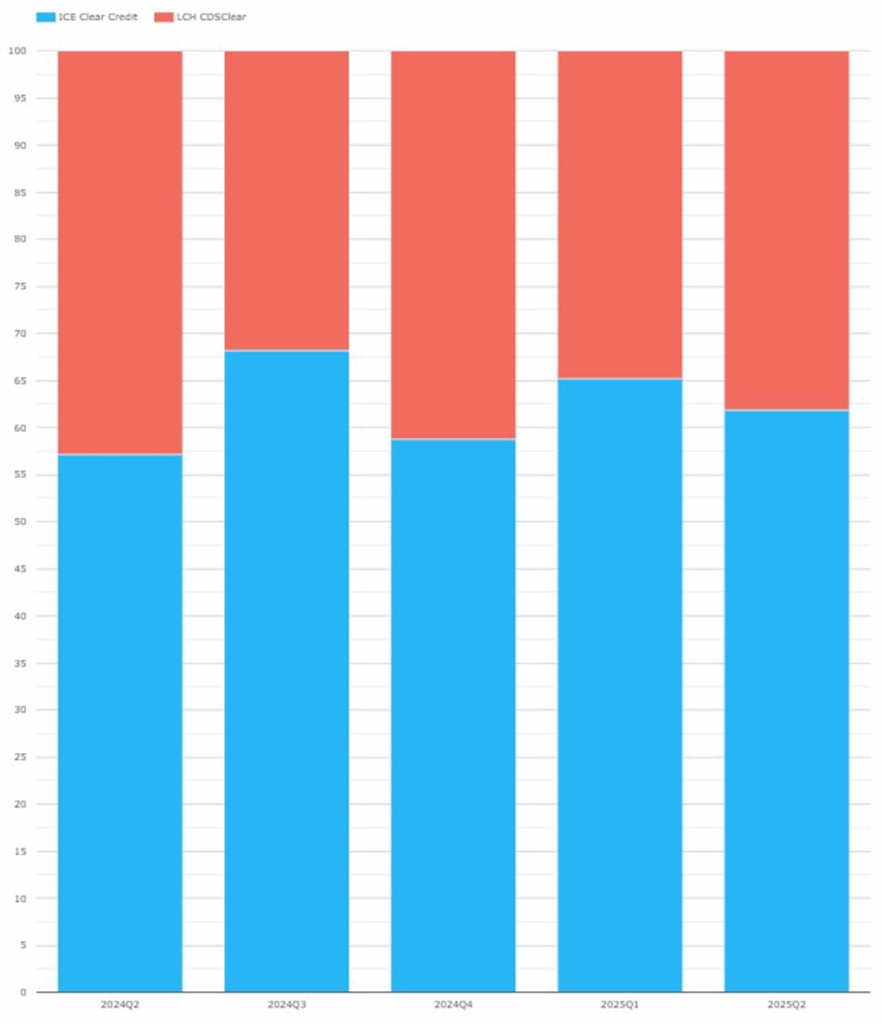
Chart 7: Quarter-by-quarter EUR single-name CDS market share by CCP.
Chart 7 shows that EUR single-name CDS CCP market shares shifted up and down over the last five quarters.
- ICE Clear Credit had 62 percent in Q2 2025, up YoY from 57 percent in Q2 2024, but down QoQ from 65 percent.
- LCH CDSClear had 38 percent, up YoY from 43 percent, but down QoQ from 35 percent.
Next, EUR iTraxxSwaptions continue to show movement.

Chart 8: Quarter-by-quarter EUR iTraxx swaptions market share by CCP.
Chart 8 shows that LCH took back some of ICE’s recent market share gains.
- ICE Clear Credit had 53 percent of EUR iTraxx swaptions in Q2 2025, up YoY from 13 percent in Q2 2024, but down QoQ from 71 percent.
- LCH CDSClear had 47 percent, down YoY from 87 percent, but up QoQ from 29 percent.
Next, we come to JPY CDX and CDS.
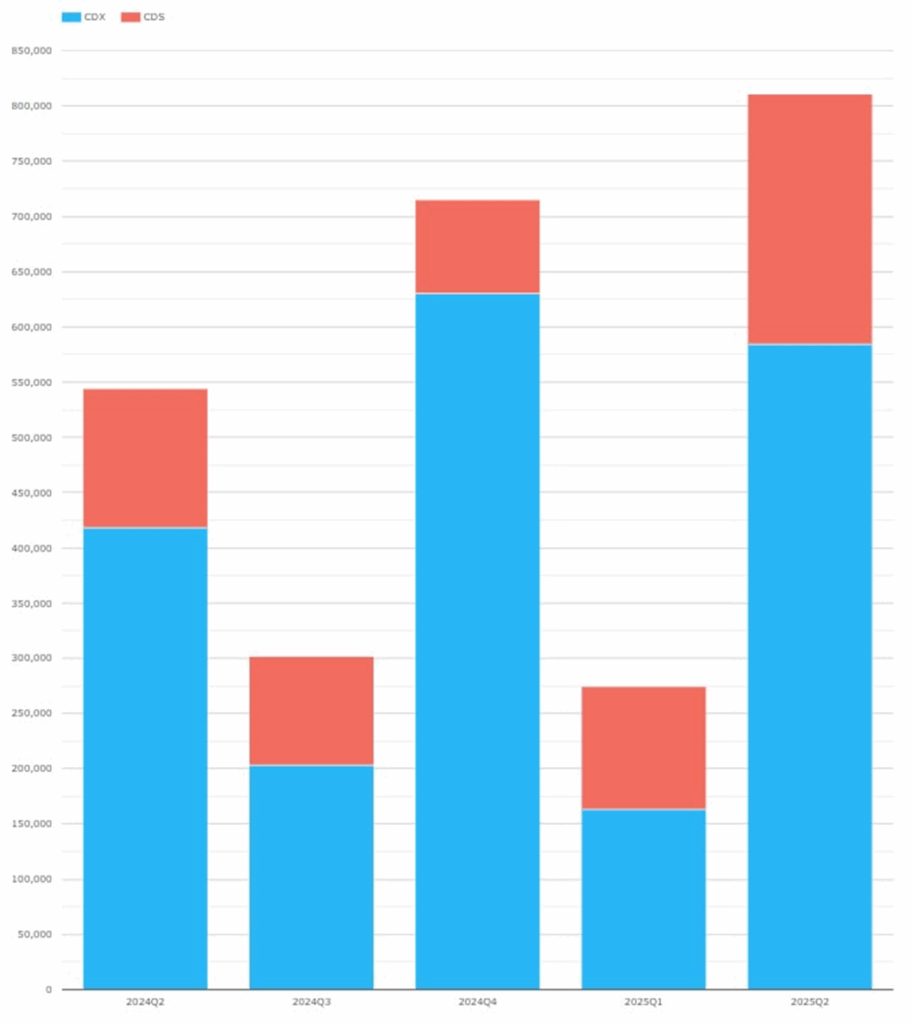
Chart 9: Quarter-by-quarter JPY CRD volumes by product (JPY millions).
Chart 9 shows that JPY CRD volumes in Q2 2025 were ¥810 billion, up 49 percent from ¥544 billion in Q2 2024.
- JPY CDX were ¥584 billion, up YoY 40 percent from ¥418 billion.
- JPY single-name CDS were ¥226 billion, up 80 percent from ¥126 billion.
We are unclear what is causing such large volume ups and downs from quarter to quarter. Feel free to send us your views.
Also, all the volumes were at JSCC.
Cleared FXD volumes
First, we look at cleared FXD by product type: non-deliverable forwards (NDFs), options, forwards, and spot.
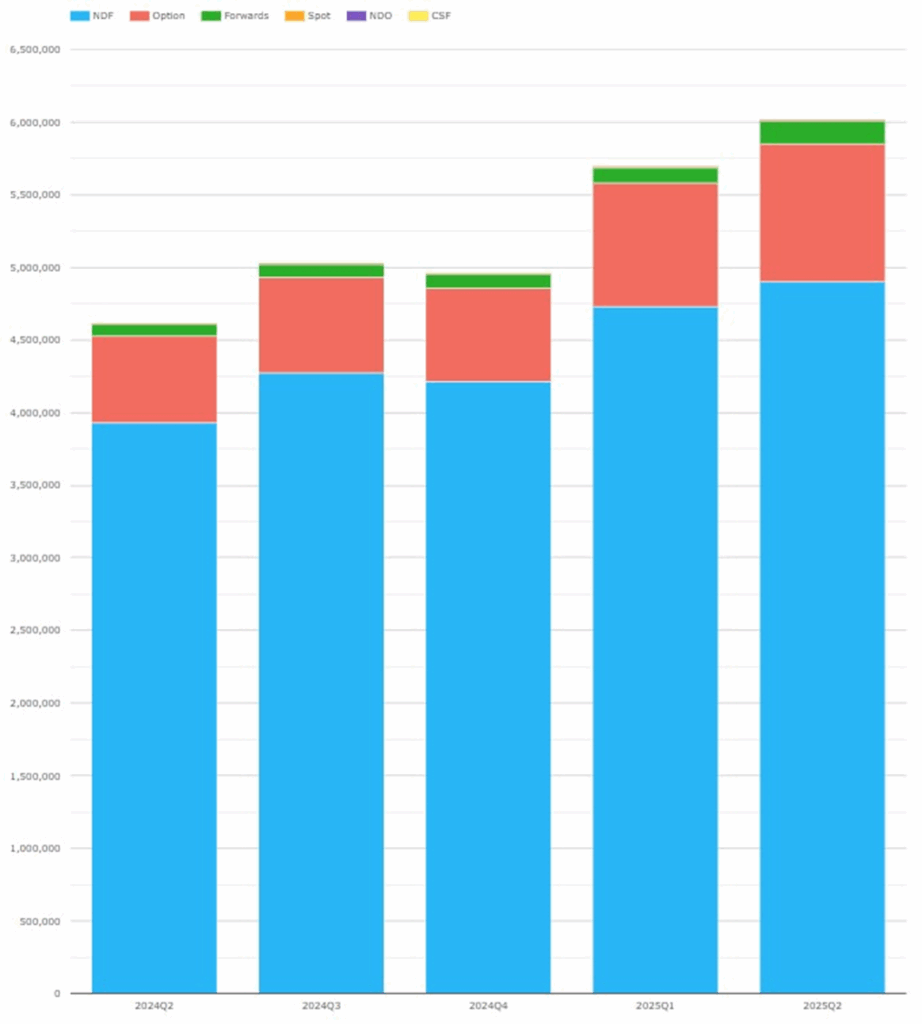
Chart 10: Quarter-by-quarter cleared FXD volumes by product (USD millions).
Chart 10 shows that FXD volumes were $6.02 trillion in Q2 2025, up 31 percent from $4.61 trillion in Q2 2024, and up QoQ from $5.70 trillion.
- NDFs were by far the largest at $4.90 trillion, up 25 percent YoY from $3.93 trillion, and up QoQ from $4.73 trillion.
- FX Options were $948 billion, up 59 percent YoY from $597 billion, and up QoQ from $847 billion.
- Deliverable forwards were $160 billion, up 92 percent YoY from $83.4 billion, and up QoQ from $110 billion.
- Spot was $2.73 billion, up 15 percent YoY from $2.38 billion, but down QoQ from $4.06 billion.
Non-NDF clearing continues to show higher growth than NDF clearing, and represented 19 percent of cleared FXD in Q2 2025 compared with 15 percent in Q2 2024 and 17 percent in Q1 2025.
Next, we view NDF by currency pair.
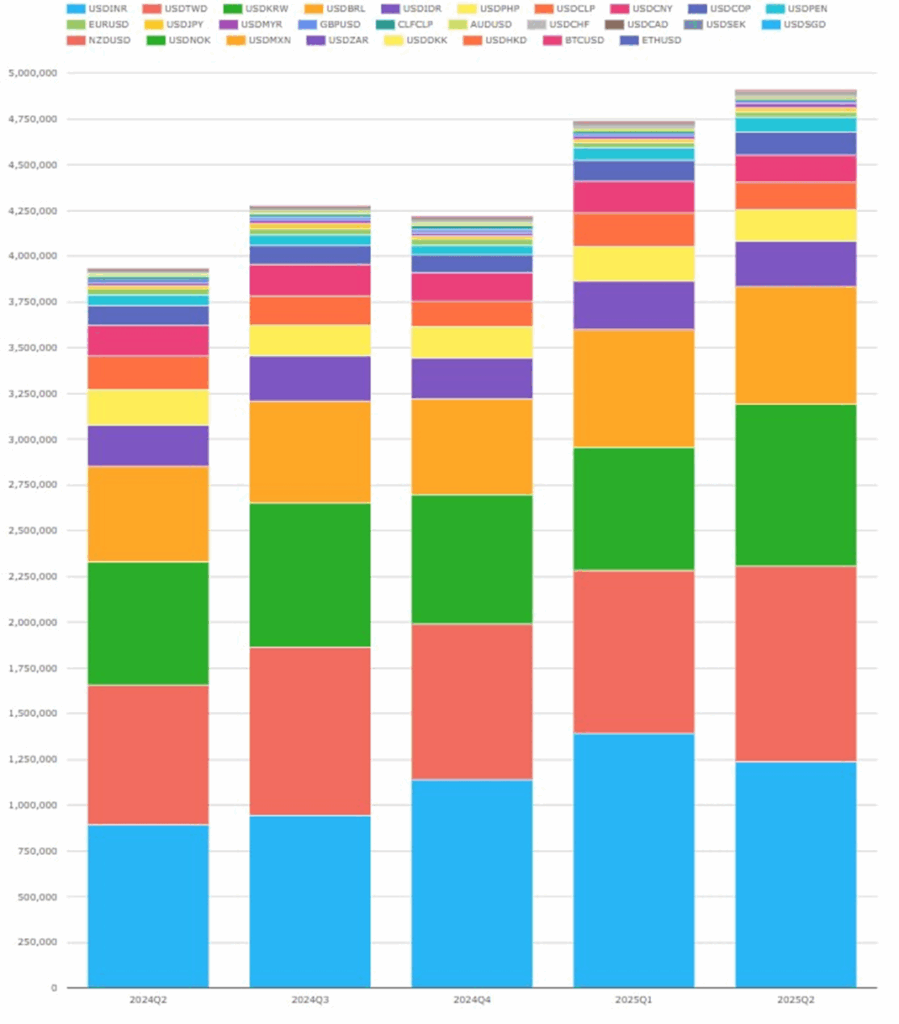
Chart 11: Quarter-by-quarter cleared NDF volumes by currency pair (USD millions).
Chart 11 enables us to break down the NDF figures from Chart 10 to the consistent top five currency pairs.
- INR was the largest in Q2 2025 at $1.23 trillion, up 39 percent YoY from $889 billion in Q2 2024, but down QoQ from $1.39 trillion in Q1 2025.
- TWD was next at $1.07 trillion, up 40 percent YoY from $765 billion, and up QoQ from $891 billion.
- KRW was $884 billion, up 32 percent YoY from $672 trillion, and up QoQ from $670 billion.
- BRL was $645 billion, up 23 percent YoY from $524 billion, and up QoQ from $643 billion.
- IDR was $251 billion, up 10 percent YoY from $227 billion, but down QoQ from $265 billion.
Now, we look at NDF market share by CCP.
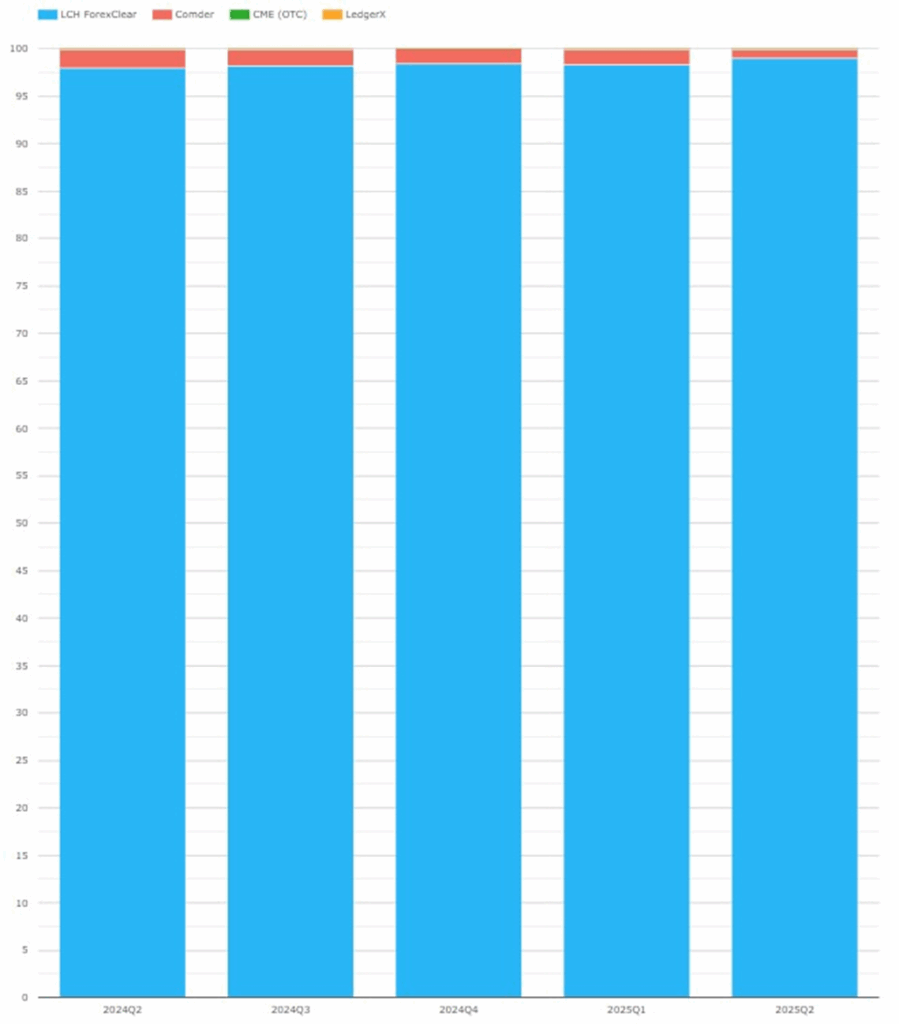
Chart 12: Cleared NDF volumes market share by CCP.
Chart 12 shows ForexClear continuing to dominate market share.
- LCH ForexClear had 99.0 percent in Q2 2025, up from 97.9 percent in Q2 2024.
- Comder had 0.9 percent, down from 2.0 percent.
- CME OTC was flat at 0.05 percent.
Now, we drill into FX Options by currency pair.
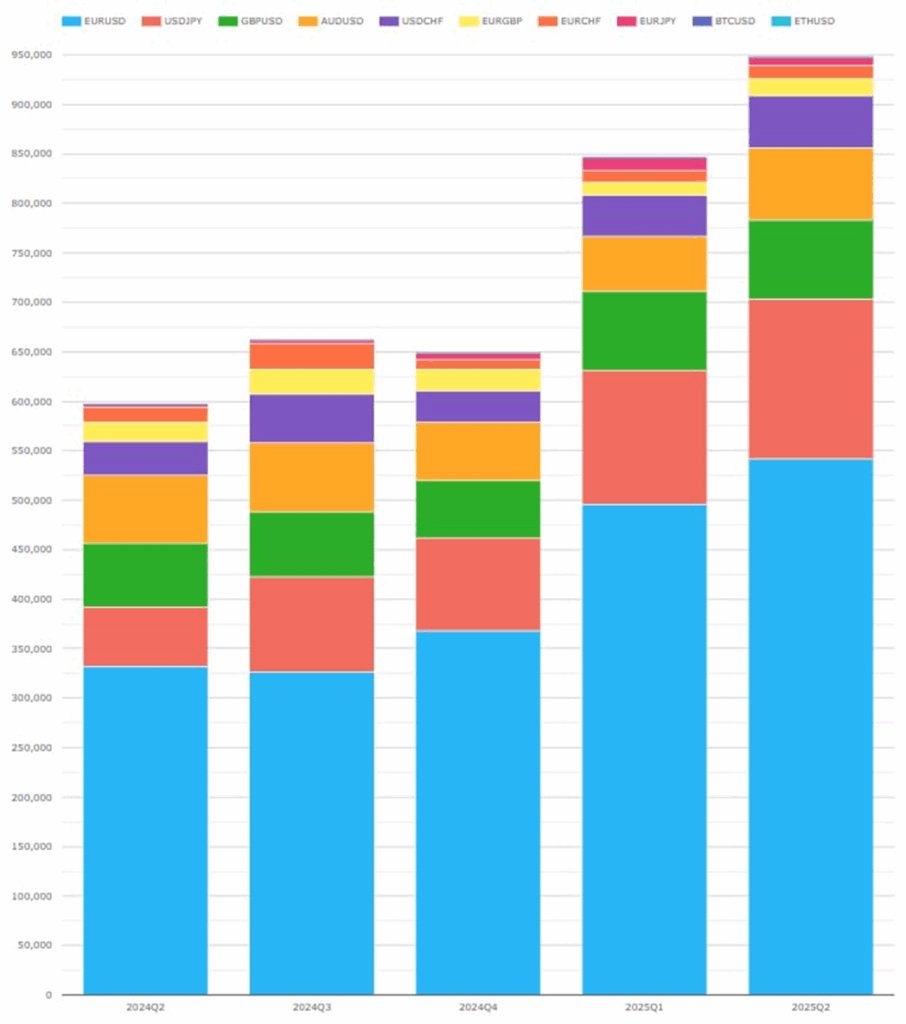
Chart 13: Quarter-by-quarter cleared FX options volumes by currency pair (USD millions).
Chart 13 enables us to break down the 59 percent YoY increase shown in chart 10 to top five currencies level.
- EUR was by far the largest at $541 billion, up 63 percent YoY from $332 billion.
- JPY was next at $162 billion, up 167 percent YoY from $60.7 billion.
- GBP was next at $80.5 billion, up 27 percent YoY from $63.4 billion.
- AUD was next at $72.7 billion, up 4.1 percent YoY from $69.9 billion.
- CHF was next at $52.8 billion, up 58 percent YoY from $33.5 billion.
Since all FX options were at LCH ForexClear, we will skip the CCP market share and instead cover FX options outstanding notional at each quarter end.
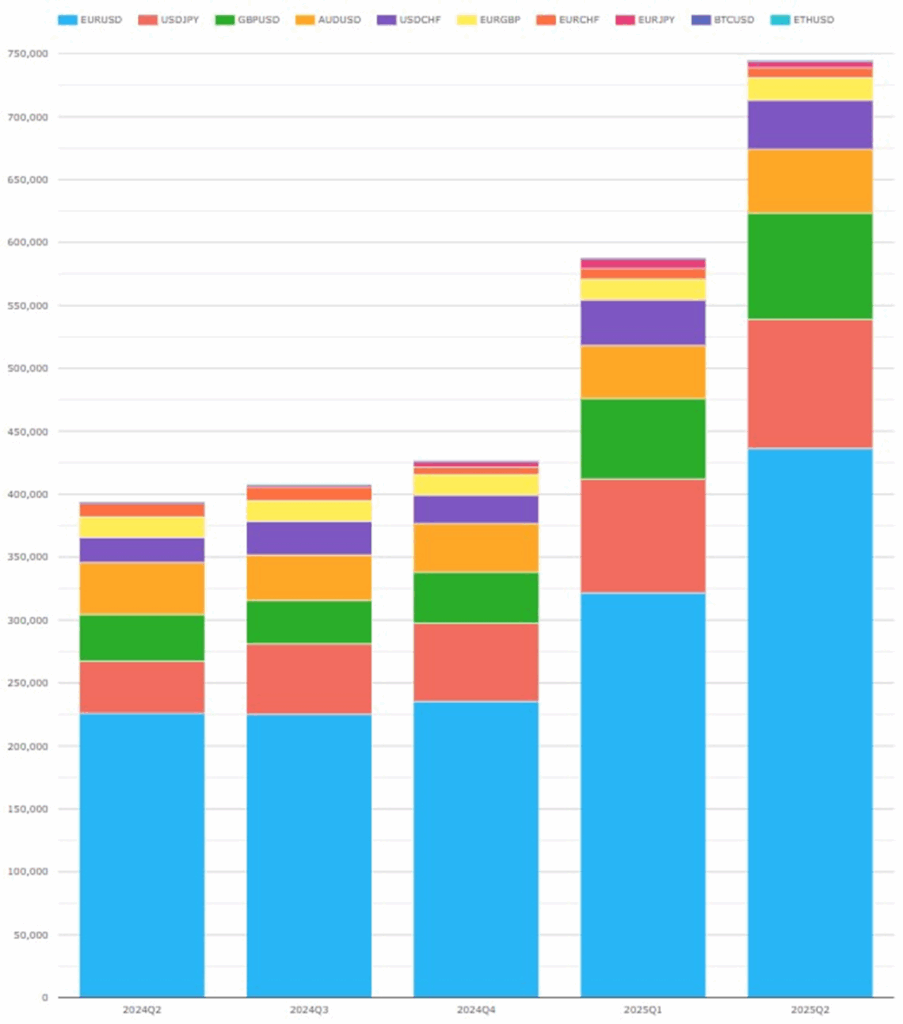
Chart 14: Quarter-by-quarter cleared FX options outstanding notional by currency pair (USD millions).
Chart 14 breaks down the $744 billion of FX options outstanding notional at the end of Q2 2025, up 89 percent YoY from $393 billion in Q2 2024.
- EUR was largest at $436 billion, up 93 percent YoY from $226 billion.
- JPY was next at $103 billion, up 152 percent from $40.9 billion.
- GBP was $84.3 billion, up 128 percent from $37.0 billion.
- AUD was $50.4 billion, up 22 percent from $41.4 billion.
- CHF was $38.9 billion, up 90 percent from $20.5 billion.
That’s It
We used 9 charts to cover CRD and 5 to cover FXD.
You can find a lot more data in CCPView, including:
- Analysis by date, week, month, quarter, or year.
- Volume metrics beyond new trade notional to trade count, average daily volume (ADV), open interest, and notional unwound/matured.
- More granular CRD volumes at index series or single-name level.
- FXD volumes for exchange traded derivatives.
Contact us if you are interested in a subscription.


