GBP swaps – what’s new? |

Today, we look at the GBP rates derivatives markets, which we do about once a year. The last time was a blog in July 2024.
Summary
- GBP cleared rates derivatives achieved $15.2 billion DV01 in Q2 2025, representing a 16% year-over-year increase and establishing the second-highest quarterly volume on record, with notional ADVs reaching £1.1 trillion in recent quarters.
- GBP derivatives maintained their position as third largest currency by DV01 share, taking 10.2% of global cleared derivatives risk, and demonstrating growth from the 7-8% range during 2022-2023.
- GBP derivatives trading activity increases were concentrated in shorter-dated instruments, particularly three-month ICE SONIA futures and two-year LCH OIS contracts, with these tenors alone had volumes in the last three completed quarters, which exceeded total volumes across all tenors in prior quarters.
- On-platform trading of GBP OIS increased slightly to 50 percent in H1 2025 – up YoY from 47 percent.
- Clearing of GBP OIS increased dramatically to 96 percent in H1 2025 – up YoY from 80 percent.
Cleared GBP derivatives market size and share
The total DV01 traded in cleared GBP cleared rates derivatives (swaps and futures) has broken recent records, as CCPView shows.
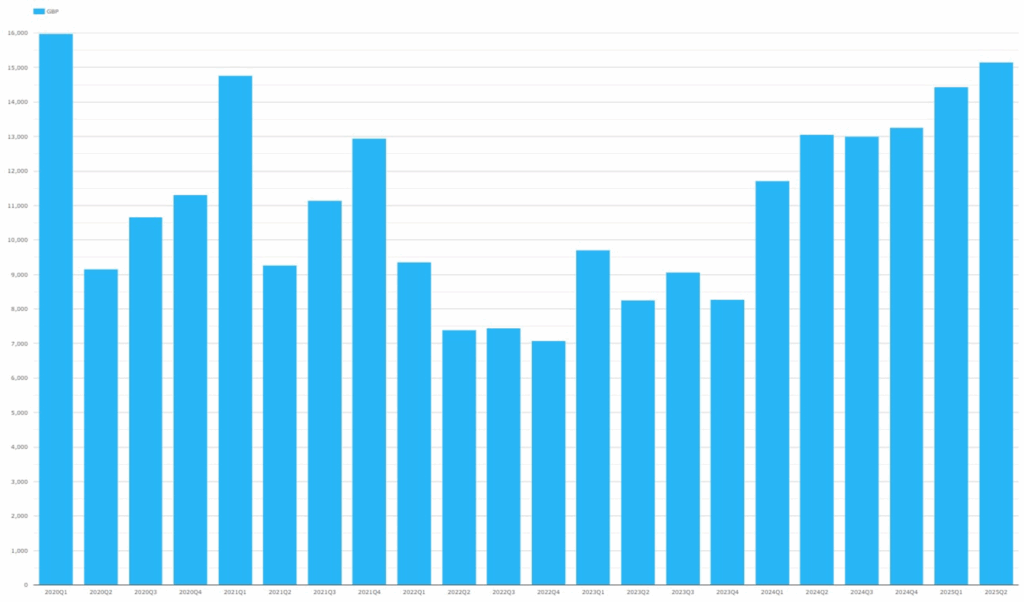
Chart 1: DV01 traded in GBP rates derivatives (USD millions). Source: CCPView
Chart 1 shows that:
- Q2 2025 GBP rates derivatives traded $15.2 billion DV01 in Q2 2025 – up 16 percent YoY from $13.1 billion DV01 in Q2 2024, and up 5.5 percent QoQ from $14.4 billion DV01 in Q1 2025.
- DV01s by quarter for GBP swaps and futures have been above $13.1 billion since Q2 2024, while they ranged between $7 billion and $10 billion during 2022 and 2023.
- Q2 2025 was the second highest quarter ever, only outstripped by the Covid-19 driven peak of $16.0 billion DV01 in Q1 2020.
Let us compare GBP derivatives DV01s with other currencies.

Chart 2: share by currency of DV01 traded in all cleared rates swaps and futures. Source: CCPView
Chart 2 shows that in Q2 2025:
- GBP’s share of DV01s is consistently third behind EUR and USD.
- Q2 2025 GBP DV01s were 10.2 percent of cleared derivatives risk traded in Q2 2025 – slightly up YoY from 10.0 percent in Q2 2024.
- GBP’s share of DV01s was in the 11 to 14 percent range during 2020 and 2021, and was in the 7 to 8 percent range during 2022 and 2023.
Cleared GBP notional volumes
Looking at volumes in notional terms by pulling notional average daily volumes (ADV) for GBP rates swaps and futures from CCPView shows the following.
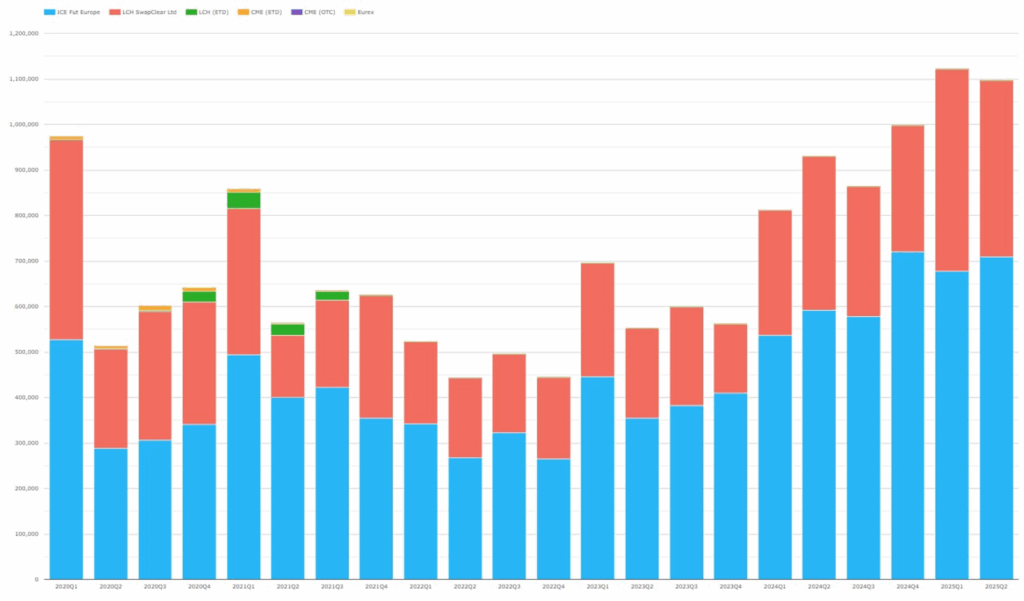
Chart 3: notional ADV traded of cleared GBP rates swaps and futures by CCP (GBP millions). Source: CCPView
Chart 3 shows even more impressive increases in notional than in DV01.
- ADV in GBP linear cleared rates derivatives hit a record £1.12 trillion in Q1 2025 and £1.10 trillion in Q2 2025 – both quarters exceeding the prior peak of £974 billion in Q1 2020. Note that listed SONIA and gilt options volumes are excluded, because the risk (and therefore notional) is not directly comparable.
- ICE Europe futures – mainly SONIA futures – hit a record £720 billion in Q4 2024, with Q1 and Q2 2025 not far behind and higher than all prior quarters.
- LCH SwapClear swaps – mainly SONIA OIS – hit a record £444 billion in Q1 2025, exceeding the prior peak of £439 billion in Q1 2020.
- Notional volumes per quarter have now roughly doubled since Q2 2023.
The cause of the larger percentage increases in notional than in DV01 is illustrated by the next chart.
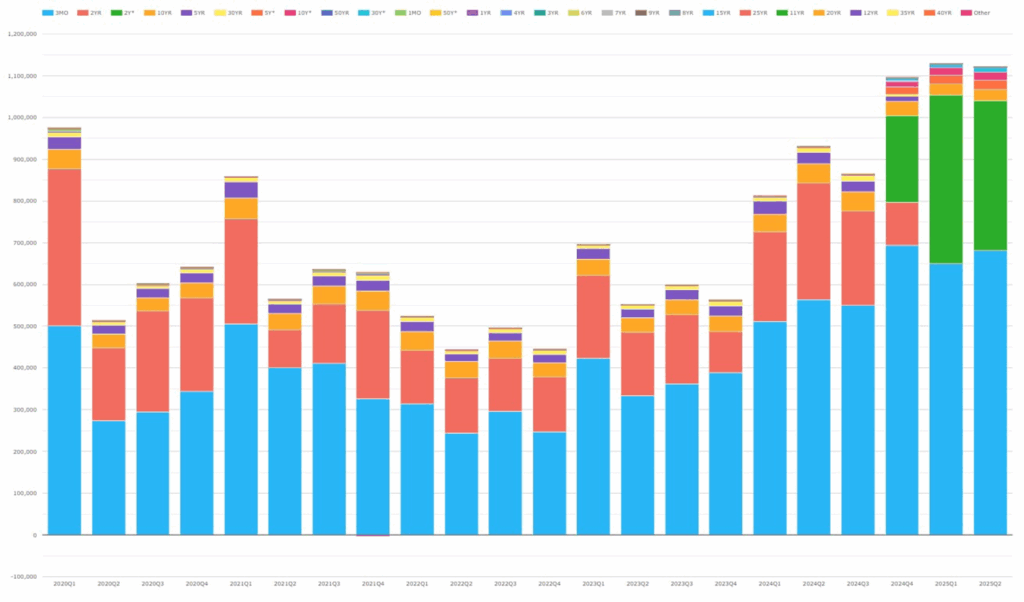
Chart 4: notional ADV traded of cleared GBP rates swaps and futures by tenor (GBP millions). Source: CCPView
Chart 4 shows that much of the volume increase came in shorter dated trades.
- Three-month tenors (3MO, mainly ICE SONIA futures) and two-year tenors (2YR and 2Y* combined, mainly 2Y LCH SwapClear OIS) have dynamically changing volumes while all tenors longer than two-year have rather static volume.
- In particular, the combined ADV in three-month and two-year tenors in Q4 2024, Q1 2025, and Q2 2025 each surpassed the all tenors’ total ADV in any previous quarter.
Now let us look at which contracts are trading in GBP futures.
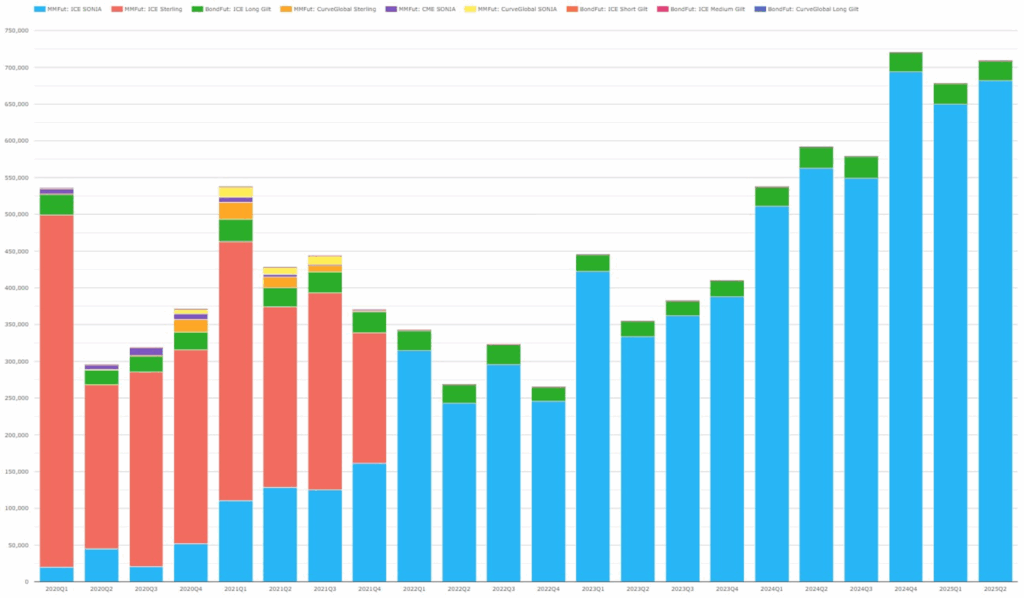
Chart 5: notional ADV traded of GBP rates futures by contract type (GBP millions). Source: CCPView
Chart 5 shows the breakdown of the ICE volumes in chart 3:
- ICE SONIA futures (MMFut: ICE SONIA) dominated the ADV, trading £694 billion in Q4 2024 – a new record.
- Q2 2025 ADVs in ICE SONIA futures were £682 billion – up 21 percent YoY from £563 billion in Q2 2024, which was a record at the time.
- ICE SONIA contract also surpassed all prior quarters’ ADV of the ICE sterling contract (MMFut: ICE Sterling), which it superseded in the LIBOR transition.
- Prior concerns that LIBOR cessation would permanently lower volumes have been allayed.
US reported GBP rates swaps
We can use SDRView to get at the electronic trading and clearing dynamic.
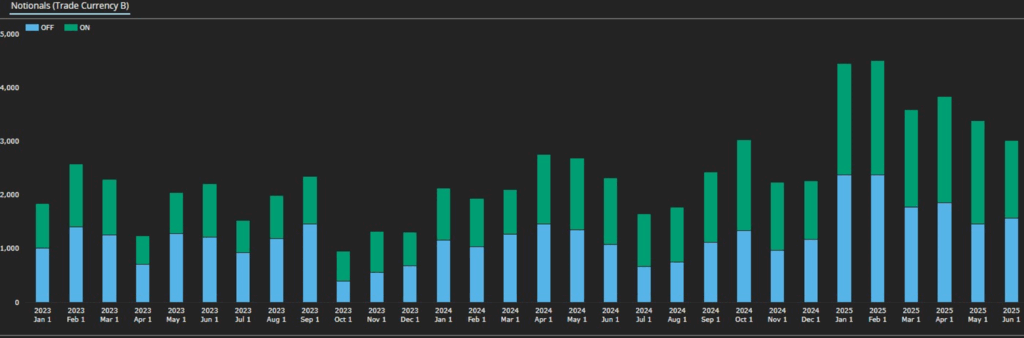
Chart 6: month-by-month US SDR-reported notionals traded in GBP OIS by on- vs. off-platform (GBP millions). Source: SDRView
Chart 6 shows sizeable increases in the amount of GBP OIS notional reported to US SDRs in the first half of 2025. This is consistent with the CCPView charts above and our recent Q2 2025 CCP IRD volumes blog.
- US-reported GBP OIS were higher in each the first five months of 2025 than any prior month. The new record month was February 2025 with £4.51 trillion traded – up 49 percent from the record up to the end of 2024, which was £3.03 trillion in October 2025.
- Trading on-platform (that is on a SEF, OTF, or MTF) was also higher in each the first five months of 2025 than any prior month. The new record month was also February 2025 with £2.14 trillion traded – up 26 percent from the prior record of £1.70 trillion in October 2024.
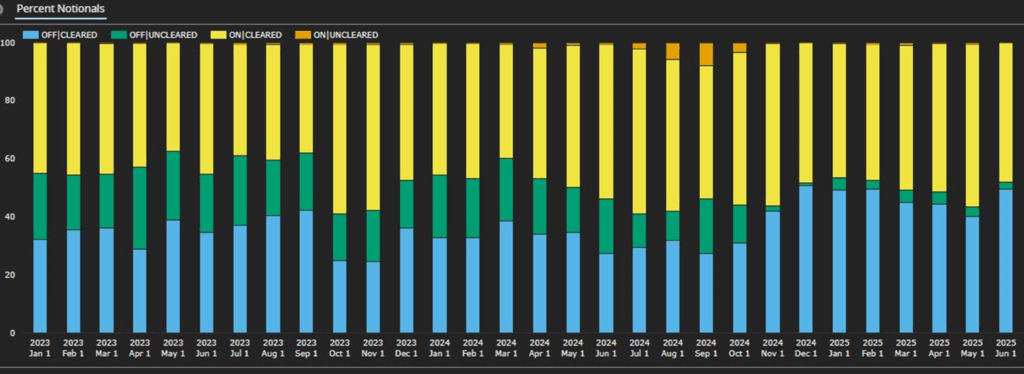
Chart 7: month-by-month US SDR-reported GBP OIS notional traded share by on- vs. off-platform and by cleared vs. uncleared. Source: SDRView
Chart 7 illustrates that:
- The month-by-month GBP OIS on-platform percentage (cleared and uncleared combined) averaged 50 in half one of (H1) 2025, up slightly from 47 in H1 2024.
- The month-by-month GBP OIS cleared percentage (on- and off-platform combined) averaged 96 in H1 2025, up dramatically from 80 in H1 2024.
Such a big shift towards clearing, leads me to be curious about the breakdown of uncleared activity.
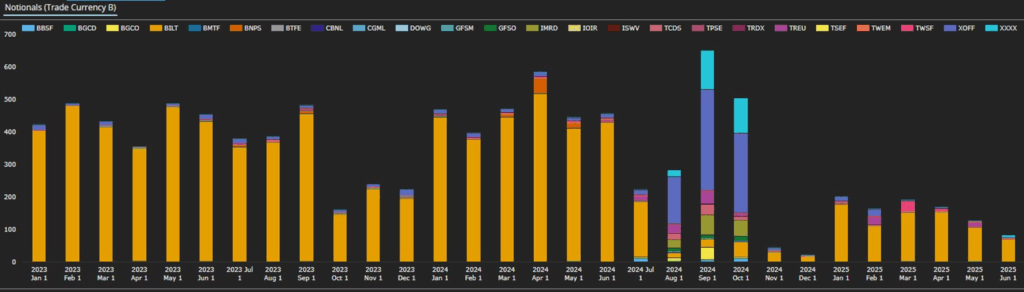
Chart 8: month-by-month US SDR-reported notionals traded in uncleared GBP OIS – split by platform id (GBP millions). Source: SDRView
Chart 8 shows that:
- At a time of marked increase in overall GBP OIS volumes, uncleared activity reduced from over £400 billion each month in H1 2024 to £200 billion or below in each month of H1 2025.
- Up to July 2024, uncleared trades were dominated by bilateral (BILT) with little on-platform uncleared trade activity.
- In August, September and October 2024, off-platform shifted sharply from BILT to platform tradable instruments (XOFF) and non-platform tradable instruments (XXXX).
- In the same three-month period, there was a material increase in on-platform activity: mainly for BGC (BGCO), GFI (GFSO), Tullet (TCDS, IMRD), Tradition (TRDX), and TradeWeb (TREU). All these platform ids represent European OTFs or MTFs rather than SEFs.
- From November 2024 onwards, the pattern reverted – uncleared trades were again dominated by BILT with little on-platform uncleared trade activity.
We are not sure whether this unusual temporary pattern caused by genuine trading activity changes, or perhaps by an initiative to correct US-reporting anomalies for activity traded on European platforms. However, we can say that the month-by-month US reported cleared percentage for GBP OIS increased from 80 to 96 percent on average between H1 2024 and H1 2025.
Recap
- GBP cleared rates derivatives achieved $15.2 billion DV01 in Q2 2025, representing a 16% year-over-year increase and establishing the second-highest quarterly volume on record, with notional ADVs reaching £1.1 trillion in recent quarters.
- GBP derivatives maintained their position as third largest currency by DV01 share, taking 10.2% of global cleared derivatives risk, and demonstrating growth from the 7-8% range during 2022-2023.
- GBP derivatives trading activity increases were concentrated in shorter-dated instruments, particularly three-month ICE SONIA futures and two-year LCH OIS contracts, with these tenors alone had volumes in the last three completed quarters, which exceeded total volumes across all tenors in prior quarters.
- On-platform trading of GBP OIS increased slightly to 50 percent in H1 2025 – up YoY from 47 percent.
- Clearing of GBP OIS increased dramatically to 96 percent in H1 2025 – up YoY from 80 percent.
, I’ve Tested Countless to Find Them")


